


Quick answer
Search Console CSV totals can differ from the performance chart because an export may not contain the complete underlying dataset, tables can use different scopes, and filters or date ranges may differ. Some query information is withheld. Compare like with like, label exported-row totals accurately, and calculate rates from the underlying counts instead of averaging percentages.
A mismatch is a reason to inspect the data, not immediate proof that the reporting tool is broken. The first question should be whether both numbers describe the same records. A chart total and a sum of exported query rows can represent different coverage even when they came from the same property.
Record the export scope first
Before downloading, note the property, report, dates, search type and active filters. Record whether the table contains queries or pages. Use the same configuration when creating a previous-period comparison.
Google’s Search Console documentation explains the performance report’s metrics and reporting context. Query-level reporting has limitations, and table values should be interpreted within the report’s scope. [1] Do not assume that every visible table is a complete transaction ledger of all search activity.
Keep the export settings and download date with each file so colleagues can reproduce the report.
Compare the same type of table
Do not compare a current query export against a previous page export and describe the difference as growth. They group the underlying activity differently. Keep the same table type and comparable filters for both periods.
The HuzDigital SEO Report Builder accepts Search Console CSV data and summarizes the supplied rows. It does not connect to a Google account or recover rows absent from the file. Its result describes that export. [2]
If the tool’s click total differs from the chart, first sum the file’s click column independently. If the tool matches the file, investigate export coverage and report settings. If it does not match the file, inspect formatting, column recognition, decimal separators or unexpected rows before relying on the output.
| Symptom | First check | Reporting response |
|---|---|---|
| CSV clicks below chart clicks | Export coverage and query limitations | Label as exported-row clicks |
| Periods show unexpected change | Dates and active filters | Re-export comparable periods |
| CTR looks too high | Averaging of percentages | Recalculate from clicks and impressions |
| Position differs | Aggregation and row weighting | State calculation and scope |
| Queries and pages disagree | Table type and grouping | Keep separate analyses |
Calculate CTR from counts
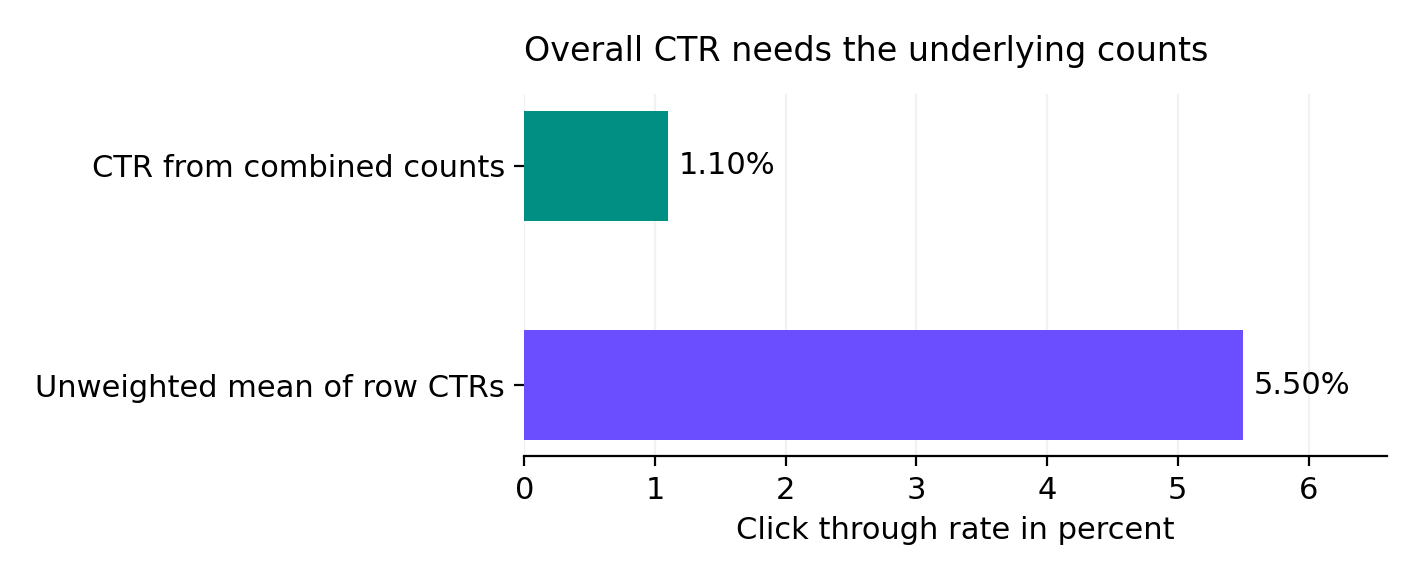
Click-through rate equals clicks divided by impressions, multiplied by 100. When combining rows, sum clicks and impressions first. An ordinary average of row percentages gives a low-volume query the same influence as a high-volume query.
Consider this hypothetical export. Query A has 10 clicks from 100 impressions, giving 10% CTR. Query B has 90 clicks from 9,000 impressions, giving 1% CTR. Averaging the two percentages produces 5.5%, but the combined result is 100 clicks divided by 9,100 impressions, or about 1.10%.
The difference is substantial because Query B carries most impressions. These hypothetical figures illustrate the calculation; they are not client results.
Illustrative calculation only. Figures are hypothetical and are not campaign benchmarks or client results.
Treat average position with care
An impression-weighted average of exported position values can summarize the supplied rows, but it should not be described as a live rank check or assumed to reproduce every Search Console aggregation. Position reflects the selected records and reporting context.
A change in average position can also reflect a change in query mix. A site may begin appearing for many new queries at lower positions while its established commercial queries remain stable. The combined average can worsen even though discovery has expanded.
Inspect important query and page groups separately. Distinguish branded and unbranded demand when the export supports that analysis. Do not explain every average-position change as a loss of authority or a penalty without further evidence.
Choose a fair comparison period
Use equal-length periods with comparable weekday composition where practical. Consider holidays, promotions and seasonal demand. Avoid comparing a complete prior month with an incomplete current month as though they represent equal opportunity.
Allow for data processing and recreate a comparable baseline if filters changed.
When a prior value is zero, a percentage-growth calculation is not meaningful in the ordinary way. State the absolute change, such as “0 to 12 clicks,” instead of presenting an infinite growth figure or silently replacing the denominator.
Explain the result without overstating causality
For the wider business interpretation, see how to read a monthly SEO report. Reconciled numbers are a starting point for assessing outcomes, not proof that one activity caused a change.
After checking coverage, explain it plainly: “The uploaded query rows contain 1,240 clicks. This exported-row total has different coverage from the chart.”
Separate observation from cause. A report can show that a page lost clicks; it cannot establish from that fact alone whether the cause was demand, rankings, search appearance, technical changes or the export itself. State the next check that would distinguish those possibilities.
Frequently asked questions
Should I change the CSV to match the chart
No. Preserve the source data. Re-export with the correct scope or explain the coverage difference rather than altering numbers to make them agree.
Can I average all CTR values in a spreadsheet
That gives an unweighted average of row rates. For overall exported-row CTR, divide total clicks by total impressions.
Does the report builder show leads or sales
Not from a Search Console performance CSV. Those outcomes need separate analytics or business records and a clearly defined attribution method.
Source [1]: Google Search Console Help, Performance report. https://support.google.com/webmasters/answer/7576553
Source [2]: HuzDigital, SEO Report Builder, calculation and export limitations, reviewed September 26 2026.

About Huzaifa Mansoor
Huzaifa Mansoor is a Karachi-based SEO consultant and founder of HuzDigital, helping businesses improve technical SEO, content performance, Local SEO and AI-search visibility.